What is a megawatt of data centre? A field guide to MW, PUE, Tiers and GPU-hours
MeitY says India has about 1,575 MW of data centres. CBRE says it is heading for 2 GW. Both are right. Here is what every word in those headlines is actually counting.

The short version · five beatsOpen ↓Close ↑
- AnchorA headline says India has crossed a round number of gigawatts of data centres.
- CrackIn one quarter, MeitY, Savills, Cushman & Wakefield and CBRE published four different numbers for the same country.
- MachineCapacity is power, not floor space: IT load versus facility load, PUE and WUE overheads, Uptime Tiers, rack densities rising from ~9 kW to 132 kW AI cabinets, and GPU-hours as the unit of rent.
- The truthThe headline number is set by whose ruler you use, and in India nobody is yet required to hold up the efficiency ruler at all.
- Send-lineA data centre is a power plant running backwards. Count its megawatts, not its floors.
Sooner or later you will read a headline that says India's data centres have crossed some round number of gigawatts. It will feel like a fact. It is closer to a measurement taken with somebody's own ruler.
Look at what was published in a single quarter. In August 2026, MeitY told the Lok Sabha that India's data-centre capacity had grown from 375 MW in 2020 to "about 1575 MW." In September, Savills put India's operational stock at about 1.8 GW of IT load at the end of June. Cushman & Wakefield said nearly 1.8 GW. CBRE, the house Vayam uses for capacity, said India added about 130 MW in the first half of 2026 and is on track to reach 2 GW by December.
Same country, same months, four numbers. None of them is wrong. They are counting different things. This is a field guide to what.
Why is data-centre capacity measured in megawatts, not square feet?
Start with the one idea that makes the rest easy: a data centre is a power plant running backwards.
A power plant takes in fuel and sends out electricity. A data centre takes in electricity and, once the computing is done, sends out almost all of it as heat. What limits the building is not how many square feet it has. It is how much power the grid will deliver to its gate, and how much heat its machinery can carry away.
So the industry rates a data centre the way you would rate a power station, by its megawatts. One megawatt (MW) is a thousand kilowatts. One gigawatt (GW) is a thousand megawatts. When a developer says a campus is "100 MW," it is telling you the size of its electrical connection, not the size of its floor.
What is IT load, and why do reports disagree by hundreds of megawatts?
Inside the backwards power plant there are two kinds of consumer.
IT load is the power drawn by the computing equipment itself: servers, storage and network gear. Facility load is everything: the IT load plus the chillers, fans, pumps, the losses in the uninterruptible power supplies, and the lights. Capacity headlines in India are usually stated in IT load. Savills says so explicitly, writing "MW IT" against every figure.
Then come the boundary questions. Is a hall counted when it is built, when it is powered, or when a tenant moves in? Does the count include a company's private, captive data centre, or only buildings run by operators who lease space? Savills' stock, by its own note, includes hyperscaler, enterprise and edge facilities run by operators.
Those choices produce real gaps. For the first half of 2026, CBRE counted about 130 MW of new supply, as reported by NBM&CW. Savills counted 258 MW IT for the same six months. That is not a rounding difference. It is two definitions of "added."
What is PUE, and what is a good PUE?
If the IT load is the useful work of the backwards power plant, everything else is its overhead. Power Usage Effectiveness, or PUE, measures that overhead. It is total facility energy divided by IT equipment energy, a metric introduced by The Green Grid in 2007.
A PUE of 1.0 would mean every unit of electricity went into computing. A PUE of 1.5 means that for every 100 units the servers use, the building spends another 50 on keeping them cool and powered.
What does good look like? In the Uptime Institute's 2025 global survey of more than 800 operators, the weighted average PUE was 1.54, the sixth year it has barely moved. Facilities commissioned in the previous five years averaged 1.48. Those of 20 MW and above averaged 1.44. Many new sites in cold, high-latitude parts of North America and Europe manage 1.3 or better.
Climate is the catch, and Uptime says so: where it is hot and humid, the most efficient ways of rejecting heat do not always work. For an Indian reference point, NPCI's Hyderabad data centre was designed for a PUE of 1.59, ETGovernment reported in 2020. Most Indian operators do not publish theirs.
What is WUE?
Many data centres cool themselves by evaporating water, the way sweat cools skin. Water Usage Effectiveness, or WUE, is The Green Grid's measure of that: annual site water use divided by IT equipment energy, in litres per kilowatt-hour. The ideal is zero.
There is a trade-off hiding here. A plant that evaporates more water can often run its chillers less, so a better PUE can come with a worse WUE. We look at what that means for India's thirsty cities in The building that drinks.
Does India regulate PUE or WUE?
Not in the sense of requiring anyone to meet or report a number.
The Bureau of Energy Efficiency's main data-centre guidance is still a 2010 compilation of best practices produced with CII, which CEEW described in February 2026 as the extent of national guidance, alongside an "absence of performance standards such as power usage effectiveness (PUE), water usage effectiveness (WUE), or carbon benchmarks" across state policies.
The ruler now exists. In August 2026 the government told the Lok Sabha that the Bureau of Indian Standards has published Indian Standards on PUE, WUE and related metrics, and that BEE's building codes contain provisions relevant to data centres. In October 2026, NITI Aayog's evaluation framework for states recommended that BEE, BIS and MeitY standardise how PUE and WUE are measured and reported, and that BEE assess bringing eligible data centres under its Designated Consumer regime. A recommendation is not a rule. Today, nobody is obliged to hold the ruler up.
What do Tier I, II, III and IV mean?
Tiers describe how a data centre survives trouble, not how big or efficient it is. They come from the Uptime Institute's Tier Standard.
- Tier I, basic capacity: the site must shut down for maintenance, and a failure will hit it.
- Tier II, redundant capacity components: spare generators, chillers or UPS modules, but a single distribution path, so site-wide shutdowns for maintenance are still needed.
- Tier III, concurrently maintainable: every component and path can be taken out for planned work without stopping the computers.
- Tier IV, fault tolerant: a single equipment failure or path interruption will not affect operations.
Uptime is careful to say a higher Tier is not "better," only suited to a different business. Indian supply is moving up the ladder anyway: CBRE says Tier IV facilities made up 43% of supply in the first half of 2026, up from 21% in 2024.
What is rack density, and why do AI racks change the building?
A rack is the tall cabinet that holds servers. Rack density is how many kilowatts one rack draws, and therefore how much heat it throws into the room.
Uptime's 2025 survey found the typical rack drawing almost 9 kW on average, up from 8.3 kW a year earlier, and 7.5 kW if the handful of very dense sites are set aside. More than 80% of operators said they had no rack above 30 kW at all.
Now compare one AI rack. Nvidia's GB200 NVL72 puts 72 GPUs in a single liquid-cooled cabinet, and HPE's specification gives its nominal thermal design power as 132 kW, per HPE's QuickSpecs. That one cabinet draws about as much as fifteen typical racks. You cannot blow enough air through it; the heat has to leave through liquid in pipes. That is why AI halls are designed differently from the inside out, and why the GPUs themselves are a story we tell in Sovereign models, rented silicon.
Hyperscale, colocation and edge: what's the difference?
These words describe who uses the building.
A hyperscale data centre serves one very large tenant, usually a cloud company, often in buildings designed around its own equipment. Colocation is the landlord model: an operator builds the hall, the power and the cooling, and rents space to many tenants who bring their own servers. Edge data centres are small facilities placed close to users to cut delay.
On Savills' breakdown of India's stock at mid-2026, facilities serving both hyperscalers and enterprises were 55%, dedicated hyperscale 36%, enterprise-focused 8%, and edge 1%. Why so many of them cluster on the coast is its own question, answered in Why data centres live by the sea.
How many homes is one gigawatt?
Let us do this honestly, with the working shown.
The Household Consumption Expenditure Survey 2022-23 suggests an Indian household uses about 97 kWh of electricity a month, as cited in a 2024 BEE and CLASP residential survey report. That is about 1,164 kWh a year.
A load of 1 GW running every hour of the year uses 1,000,000 kW × 8,760 hours = 8,760,000,000 kWh, or 876 crore units.
Divide: 8,760,000,000 ÷ 1,164 ≈ 75 lakh homes.
If that 1 GW is IT load and the building runs at a PUE of 1.5, the facility draws 1.5 GW. Then the sum is 13,140,000,000 ÷ 1,164 ≈ 1.13 crore homes.
Two cautions. BEE and CLASP's own sample, which is not nationally representative, averaged 1,805 kWh a household a year; on that figure, 1 GW of continuous load equals about 48.5 lakh homes. And no data centre runs its whole rated capacity flat out all year. Treat these as ceilings: the size of the promise, not the meter reading. What that promise asks of the grid is the subject of The grid before the plan.
What is a GPU-hour?
A GPU-hour is one graphics processor working for one hour. It is how AI computing is priced and rented. KPMG's July 2026 report notes that the IndiaAI Mission offers GPU access at a subsidised rate of about USD 0.8 per GPU-hour.
Put it back into the backwards power plant. Nvidia lists the H100 SXM at a maximum of 700 W, so one GPU-hour at full tilt is up to 0.7 kWh for the chip alone, before cooling or the rest of the server. A thousand such GPU-hours is up to 700 kWh, roughly seven months of electricity for the average household above.
What to ask next time
The numbers in these headlines are real. They are never self-explanatory. Before you repeat one, hand it four questions: is this IT load or facility load; operational, under construction or planned; operator-run only, or captive too; and whose count is it? If the article cannot answer them, you have read a press release, not a measurement.
Sources 16
- Lok Sabha Unstarred Question 2990: Environmentally sustainable expansion of AI infrastructure and data centres — MeitY / Lok Sabha, 2026-08-05
- Data Centre Market Watch, India H1 2026 — Savills India Research, 2026
- India Data Centre Market H1 2026 — Cushman & Wakefield, 2026-09-08
- Beyond Growth: India's Rise Among APAC's Leading Data Centre Markets — CBRE India, 2026-09-21
- India likely to add more than 200 MW in H2 2026 (CBRE) — NBM&CW, 2026-10-06
- Uptime Institute Global Data Center Survey 2025 — Uptime Institute, 2025-07
- Tier Certification — Uptime Institute, n.d.
- Water Usage Effectiveness (WUE): A Green Grid Data Center Sustainability Metric — The Green Grid, 2011
- Scaling India's Data Centre Ecosystem — CEEW and SYSTEMIQ, 2026-02-17
- Data Centre Evaluation Framework to Help States Plan for Sustainable Growth — NITI Aayog Frontier Tech Hub, 2026-10
- NPCI to set up advanced smart data center in Hyderabad — ETGovernment, 2020-07-04
- NVIDIA GB200 NVL72 by HPE QuickSpecs — HPE, n.d.
- NVIDIA H100 Tensor Core GPU — NVIDIA, n.d.
- Residential Energy Consumption Patterns and Appliance Ownership in India — BEE and CLASP, 2025
- India data centre opportunity — KPMG in India, 2026-07
- Accelerating Energy Efficiency in Indian Data Centers, Phase I — Lawrence Berkeley National Laboratory / CII, 2016
Every figure in this piece, and where it comes from 19 checked ↓
- MeitY told the Lok Sabha capacity grew from 375 MW in 2020 to about 1,575 MW (5 Aug 2026) — source
- BIS has published Indian Standards on PUE, CUE, CER and WUE; BEE codes contain provisions relevant to data centres — source
- Savills: operational stock about 1.8 GW IT at H1 2026; 258 MW IT added in H1 2026 — source
- Savills stock mix: hybrid 55%, hyperscale 36%, enterprise 8%, edge 1%; stock includes operator-owned facilities — source
- Cushman & Wakefield: operational capacity nearly 1.8 GW in H1 2026 — source
- CBRE: ~130 MW added in H1 2026, on track for 2 GW by end-2026; Tier IV share of supply 43% in H1 2026 vs 21% in 2024 — source
- PUE = total facility power / IT equipment power, introduced by The Green Grid in 2007 — source
- Uptime 2025: weighted average PUE 1.54, sixth flat year; new facilities 1.48; 20 MW+ 1.44; many high-latitude sites 1.3 or better — source
- Uptime 2025: average modal rack density almost 9 kW (8.3 kW in 2024); 7.5 kW excluding ≥30 kW sites; over 80% have no racks above 30 kW — source
- NPCI Hyderabad data centre designed for PUE 1.59 — source
- WUE = annual site water usage / IT equipment energy, in L/kWh; ideal value 0 — source
- National guidance largely limited to BEE 2010 best practices; state policies lack PUE/WUE performance standards — source
- NITI Aayog (Oct 2026) recommends BEE, BIS and MeitY standardise PUE/WUE measurement and BEE assess a Designated Consumer pathway — source
- Uptime Tier I–IV definitions: basic capacity, redundant capacity components, concurrently maintainable, fault tolerant — source
- GB200 NVL72 rack: 72 GPUs, nominal TDP 132 kW — source
- NVIDIA H100 SXM max TDP up to 700 W — source
- HCES 2022-23 suggests ~97 kWh per household per month; BEE/CLASP sample average 1,805 kWh/household-year — source
- IndiaAI Mission GPU access at subsidised ~USD 0.8 per GPU-hour — source
- BEE/CII 2010 'Energy Efficiency Guidelines & Best Practices in Indian Data Centers' — source
In this story 6
Sutradhar — “the one who holds the thread”
Patient and warm: from the thing you are holding to the system behind it, with one sustained analogy and every term defined the first time.
More from the desk
AI & Data Centers →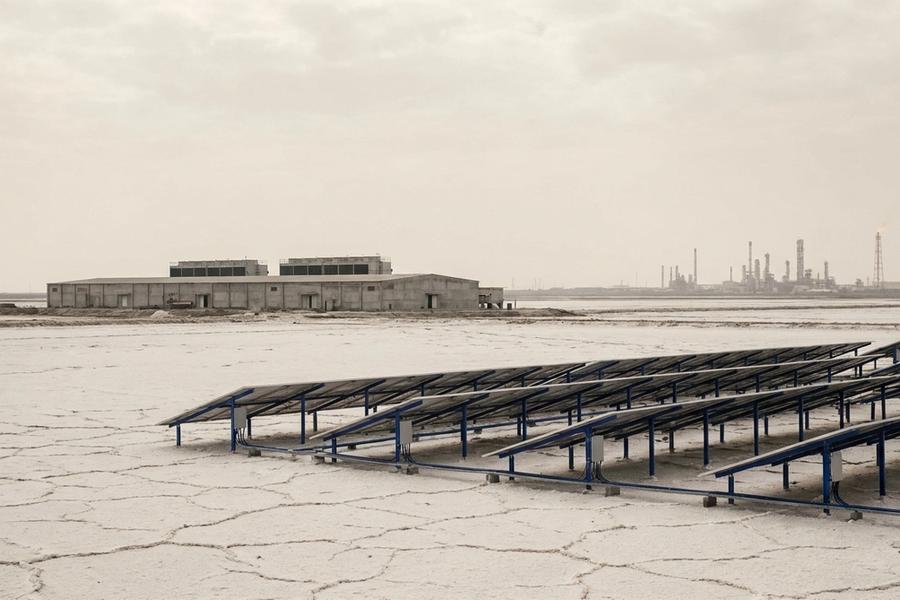
Jamnagar: why Reliance is building India's AI backbone next to its refinery
A quarter of India's refining capacity sits in one Reliance fence. Now the same site is promised 120 MW of AI compute by December, on solar power that has not yet arrived.
Online before China? The 1995 boast, and the state decisions behind India's data centres
VSNL's Independence Day internet was not first in Asia. What it began was a chain of state choices, from STPI's earth stations to RBI's data rule, that private capital has filled ever since.
The 2047 tax holiday, read carefully: the concrete must be Indian, but only on paper
India will not tax foreign cloud firms' global income from Indian data centres until 2047. An August amendment lowered the gates further. What the bargain asks for in return is thinner than it sounds.